 VASTWARD
Module 2 / Lesson 8 of 3035 min
Member
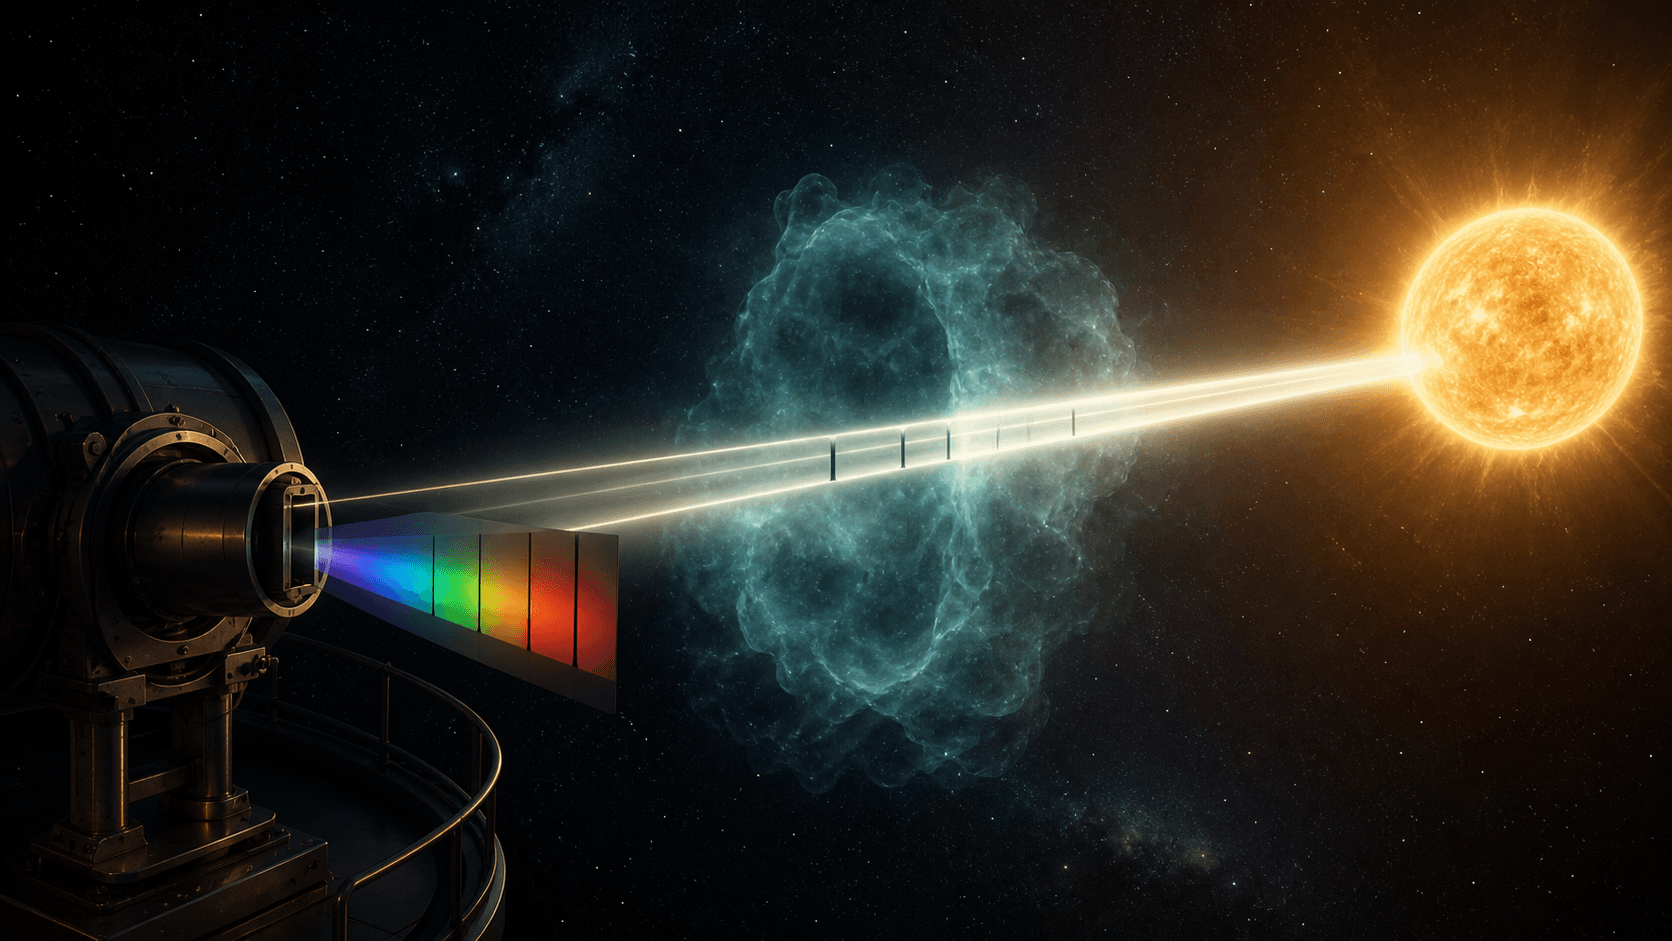
Why Do Absorption and Emission Lines Appear?
How does source–gas–observer geometry change the measured spectrum?
Rearrange a bright source, wavelength-selective gas, and an observer to understand dark dips and bright peaks.
Continue with full Academy access
This Lesson belongs to the complete route. Its title and learning question remain visible, while the explanation, lab, and debrief open with Academy membership.
Full Lesson includes
- Step-by-step bilingual explanation
- Interactive model or evidence lab
- Sources, checkpoint, and saved reflection