 VASTWARD
Module 6 / Lesson 26 of 3045 min
Member
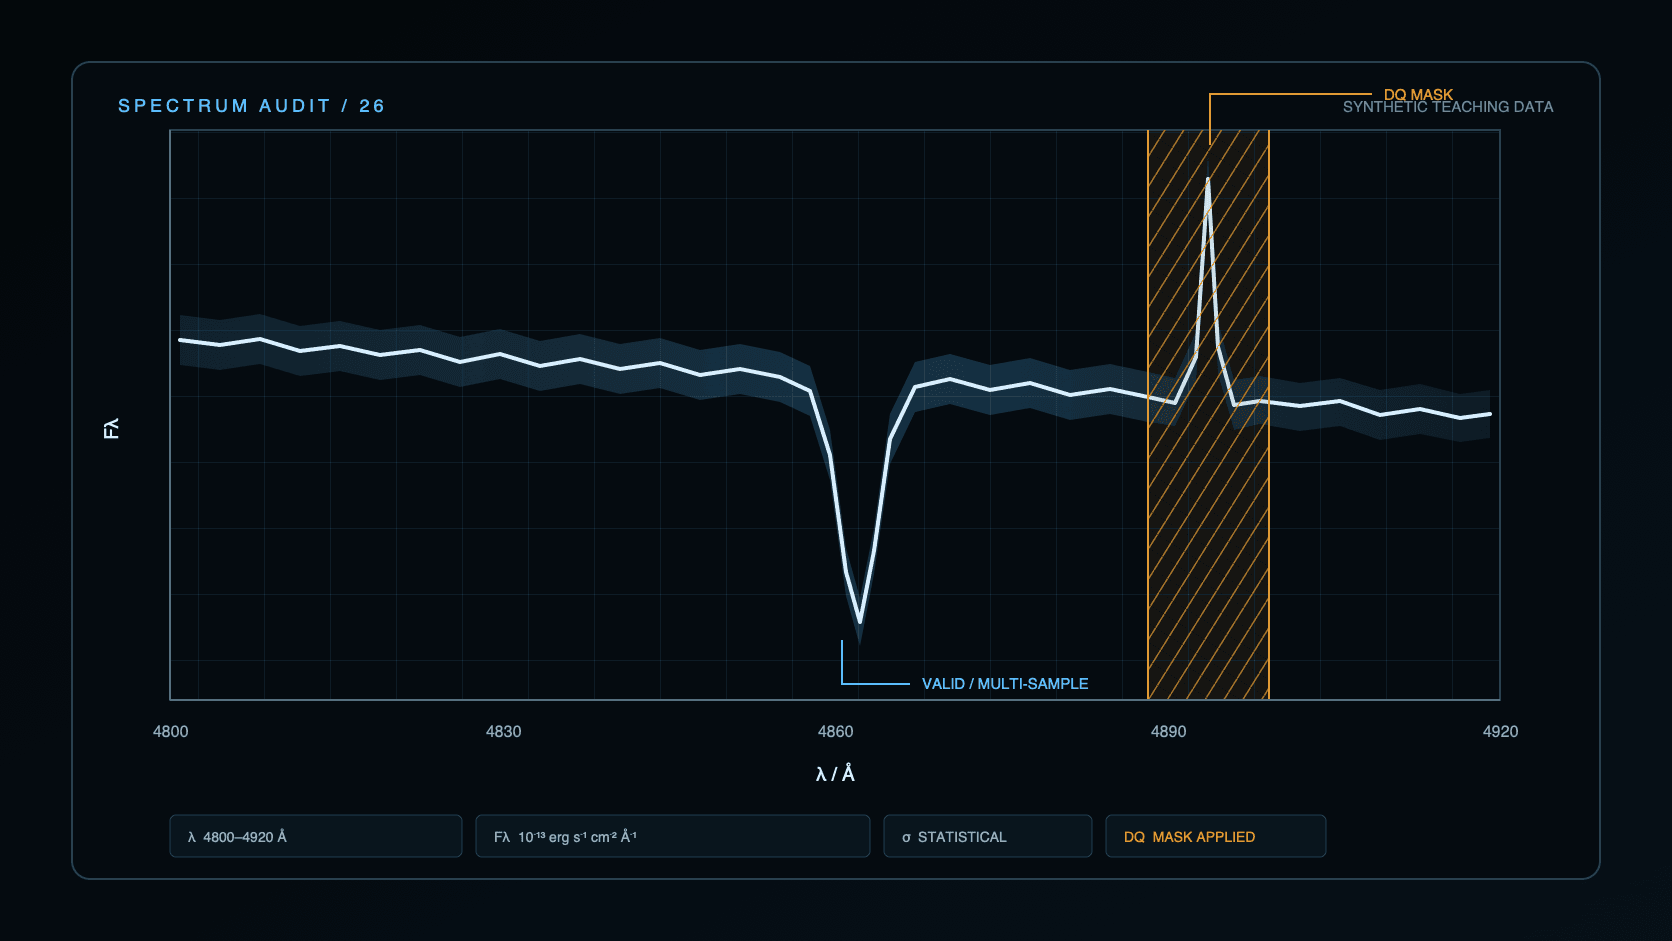
How Do You Read a Real Spectrum Plot?
Which axis, unit, uncertainty, mask, and calibration note must be checked before interpreting a feature?
Audit a spectrum as a linked data product before measuring any peak or dip.
Continue with full Academy access
This Lesson belongs to the complete route. Its title and learning question remain visible, while the explanation, lab, and debrief open with Academy membership.
Full Lesson includes
- Step-by-step bilingual explanation
- Interactive model or evidence lab
- Sources, checkpoint, and saved reflection