
Object profile · VENUS
Venus
Rocky terrestrial planet
Earth's near-size neighbour, hidden beneath carbon-dioxide air and sulfuric-acid clouds, with the hottest planetary surface.
- Atlas data reviewed
- Editorial stage
- Published
- Visibility
- Public
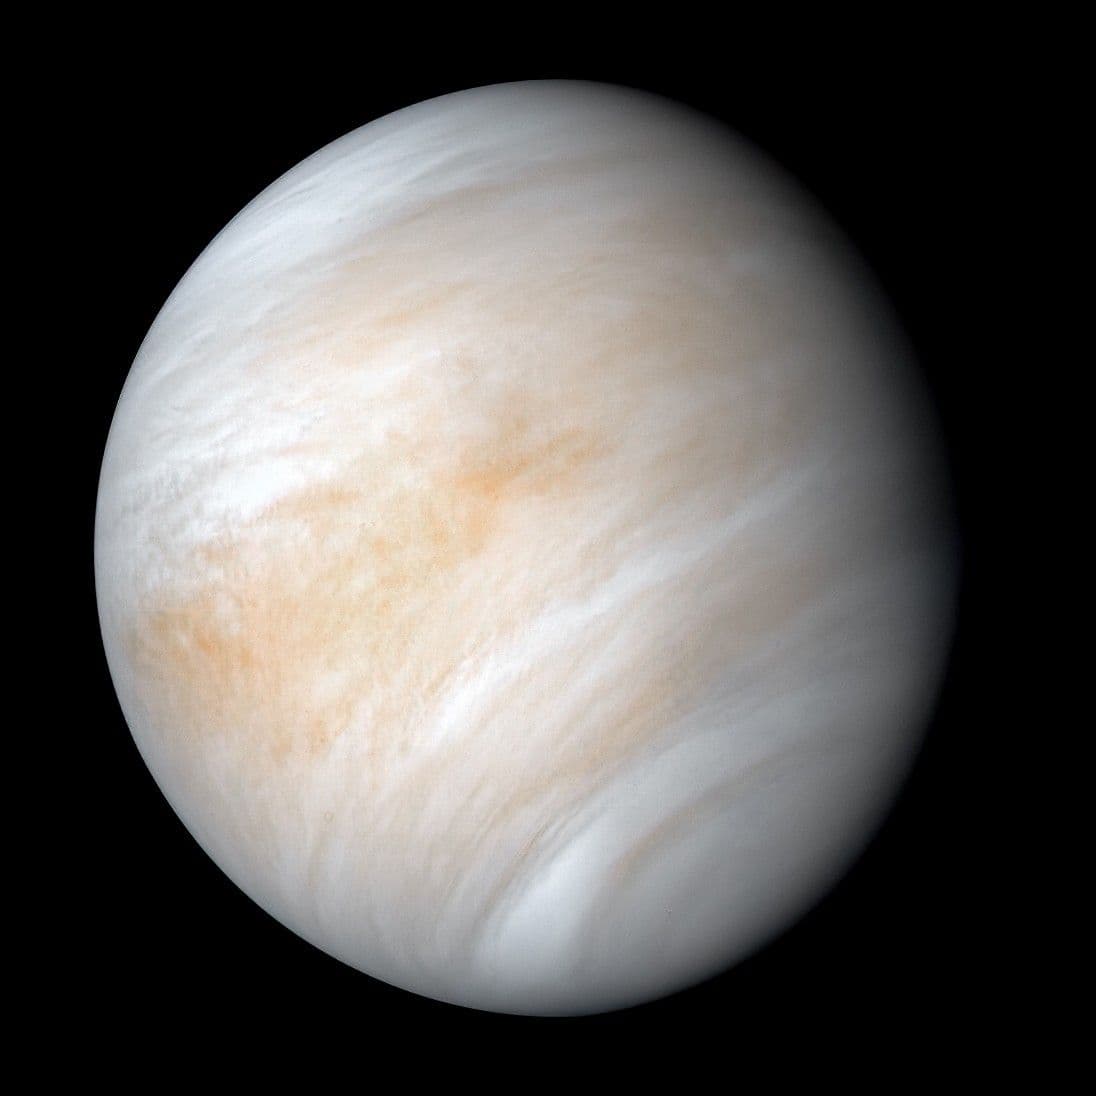 Direct observation
Processed spacecraft observation, not natural colour and not a view of the ground. Orange-filter data supplies red, ultraviolet data supplies blue, and green was synthesized from both; the visible patterns are cloud tops roughly 60 kilometres above the hidden surface.
NASA/JPL-Caltech ↗What this world is
Venus is close to Earth's size, but it is not Earth's twin climate. A crushing carbon-dioxide atmosphere traps heat, bright clouds hide the ground, and the whole planet turns very slowly in the direction opposite most planets.
Why it looks this way now
Sunlight enters the cloud system and the surface radiates heat upward. Thick carbon dioxide makes outgoing infrared energy escape only from high, cold layers, maintaining an extreme greenhouse state. Volcanic terrain records major resurfacing, while present activity is still investigated.
Where it sits
Venus is the second planet from the Sun, averaging about 108 million kilometres or 0.72 astronomical unit away. Its year lasts about 225 Earth days.
Swipe sideways to inspect the full map
The blue orbit, marker and name locate Venus without implying its live position today.
Mercury is immediately inside; Earth is immediately outside. The lower sequence preserves all eight positions.
Read the numbers
Reference values retain their units, context, evidence state and published uncertainty.
Physical measurements
- Mean radiusglobal mean
- 6,051.8kmCalculated measurementAbout 95 percent of Earth's radius.
The similar size makes the radically different climate especially useful to compare.
Published uncertainty: ± 1 km
JPL tabulated uncertainty for the adopted mean radius.
- Massglobal mean
- 4.86731E24kgCalculated measurementAbout 81.5 percent of Earth's mass.
Orbiter motion reveals total mass without sampling the interior.
Published uncertainty: ± 2.3E20 kg
Converted from the uncertainty in the JPL 10^24 kilogram table.
- Mean densityglobal mean
- 5.243g/cm³Calculated measurementSlightly less dense than Earth.
Bulk density constrains composition but does not uniquely reveal layers.
Published uncertainty: ± 0.003 g/cm³
Calculated from the adopted mass and volume.
- Reference gravitysurface
- 8.87m/s²Calculated measurementAbout 90 percent of Earth's surface gravity.
Gravity feels familiar; pressure and heat do not.
No uncertainty published in this source table
Representative gravity derived from mass and reference radius; local terrain produces small variations.
- Temperaturesurface
- 467°CDirect observationHotter than Mercury's average surface despite being farther from the Sun.
This exposes the power of a massive greenhouse atmosphere.
Approximate value
NASA's representative mean surface temperature; landers measured local conditions and remote sensing extends the picture.
- Surface pressuresurface
- 9,200,000PaDirect observationRoughly the pressure 900 metres under Earth's ocean.
It varies with topographic elevation.
Approximate value
Representative global value near 92 bars; pressure varies with elevation and weather.
Orbit and rotation
- Average distancerelative to the Sun
- 108,000,000kmCalculated measurementAbout 72 percent of Earth's average solar distance.
It receives nearly twice Earth's sunlight per square metre before reflection.
Approximate value
Rounded average distance, about 0.72 astronomical unit.
- Rotation periodrelative to distant stars
- -243.018Earth daysCalculated measurementA star-relative turn takes 243 Earth days and runs backward.
The negative value marks retrograde rotation, not negative elapsed time.
No uncertainty published in this source table
Negative sign records retrograde rotation under the JPL convention.
- Orbital periodrelative to the Sun
- 0.61519726Earth yearsCalculated measurementOne Venus year lasts about 225 Earth days.
Its rotation period is longer than its orbital year.
No uncertainty published in this source table
Sidereal orbital period from long-baseline astrometry and dynamical ephemerides.
Atmosphere and inside
Atmosphere
The atmosphere is about 96.5 percent carbon dioxide and 3.5 percent nitrogen, with trace gases. Sulfuric-acid cloud droplets reflect much sunlight, but the massive lower atmosphere produces roughly 92 bars of surface pressure.
- Carbon dioxide96.5%
- Nitrogen3.5%
- Sulfur dioxide, water vapour and trace gasesRelative abundance described; exact fraction not listed
Surface and interior
Radar maps a rocky volcanic surface through the clouds. An iron-rich core, silicate mantle and crust are plausible from bulk properties, but without seismology their exact sizes and present activity remain uncertain.
- 1Metallic core
Earth-like bulk density supports an iron-rich core, but its size and liquid state are less tightly constrained because Venus lacks seismic stations.
Scientific model - 2Rocky mantle and crust
A silicate mantle and crust are inferred from planetary formation, gravity and volcanic terrain. Their present flow and layering remain model questions.
Scientific model - 3Volcanic surface
Radar directly maps plains, volcanoes, mountains, impact craters and deformed tessera terrain through the opaque clouds.
Direct observation
How we know
Radar supplies surface images and elevation, radio tracking supplies mass and gravity, and probes plus spectroscopy measure temperature, pressure and gases. Each method sees a different layer.
- 01Calculated measurement
Synthetic-aperture radar mapping
Magellan sent radio waves through the clouds and mapped return strength and travel time into terrain and elevation.
Where this method stops
Radar brightness depends on roughness, slope and material. Shading and colour in maps are constructed, not sunlight photographs.
- 02Calculated measurement
Radio tracking and celestial dynamics
Range and Doppler data reveal spacecraft motion, Venus's gravity, total mass and orbit.
Where this method stops
The fitted solution must account for spacecraft drag, solar pressure and other bodies.
- 03Direct observation
Landers, probes and spectroscopy
In-situ probes measured pressure, temperature and gases; remote spectra map cloud and atmospheric properties.
Where this method stops
Landers survived briefly at a few sites, while remote retrievals depend on radiative-transfer and cloud models.
Evidence key
- Direct observation
- An instrument or sample recorded the phenomenon, with processing still disclosed.
- Calculated measurement
- Observed motion or signal is converted into a physical quantity using equations and reference constants.
- Scientific model
- A tested interpretation that fits observations but is not directly imaged or sampled.
- Vastward explanation
- Original beginner-facing synthesis, traceable to the source records but not itself a measurement.
- Artist visualization
- An interpretive image, not observational evidence.
Missions and instruments
Magellan
Mapped more than 98 percent of Venus with radar and measured topography and gravity from orbit.
Official mission ↗- Magellan Radar SystemRadar echoes used for synthetic-aperture images, altimetry and surface roughness.
- Magellan radio linkDoppler changes used to map gravity and study the upper atmosphere during aerobraking.
Official source trail
Links below are the exact records used for this profile. Access dates are retained with the content.
- 01
NASA Jet Propulsion Laboratory, Solar System Dynamics · dataset
Planetary Physical Parameters
- Source updated
- No source update date published
- Access checked
- 2026-07-30
- 02
NASA Science · official-page
Venus Facts
- Source updated
- 2025-06-26
- Access checked
- 2026-07-30
- 03
NASA/JPL/USGS · image
Venus Hemispherical Globes
- Source updated
- 2025-09-05
- Access checked
- 2026-07-30
- 04
NASA Science Photojournal · image
Venus from Mariner 10
- Source updated
- 2025-09-23
- Access checked
- 2026-07-30
- 05
NASA Science · official-page
Magellan
- Source updated
- No source update date published
- Access checked
- 2026-07-30
Continue exploring
Atlas is a starting point. Use these relationships to move into explanation, experiment and mission thinking.
Build a runaway greenhouse comparison
Change atmospheric opacity and see why distance alone does not set surface temperature.
labSee terrain with echoes
Turn return time and echo strength into a map, then inspect what remains ambiguous.
labCompare two near-size worlds
Separate shared size and composition from divergent water and atmospheric histories.
academy