Begin with one question
How to Read Mission Telemetry
When a vehicle is far away, how do engineers decide whether the vehicle or the data needs attention?
Read each measurement with its unit, sample time, quality, expected range, trend, and mission phase before drawing a conclusion.
By the end of this lesson, you will be able to
Mission Control cannot inspect a distant vehicle directly. Operators must decide what the measurements support without confusing a bad link with a bad spacecraft.
- 01Read a channel as value, unit, sample time, and quality together.
- 02Separate data-path health from vehicle health.
- 03Compare values and trends with the current mission phase.
- 04Correlate several channels before declaring an anomaly.
Telemetry is measurement from somewhere you cannot reach
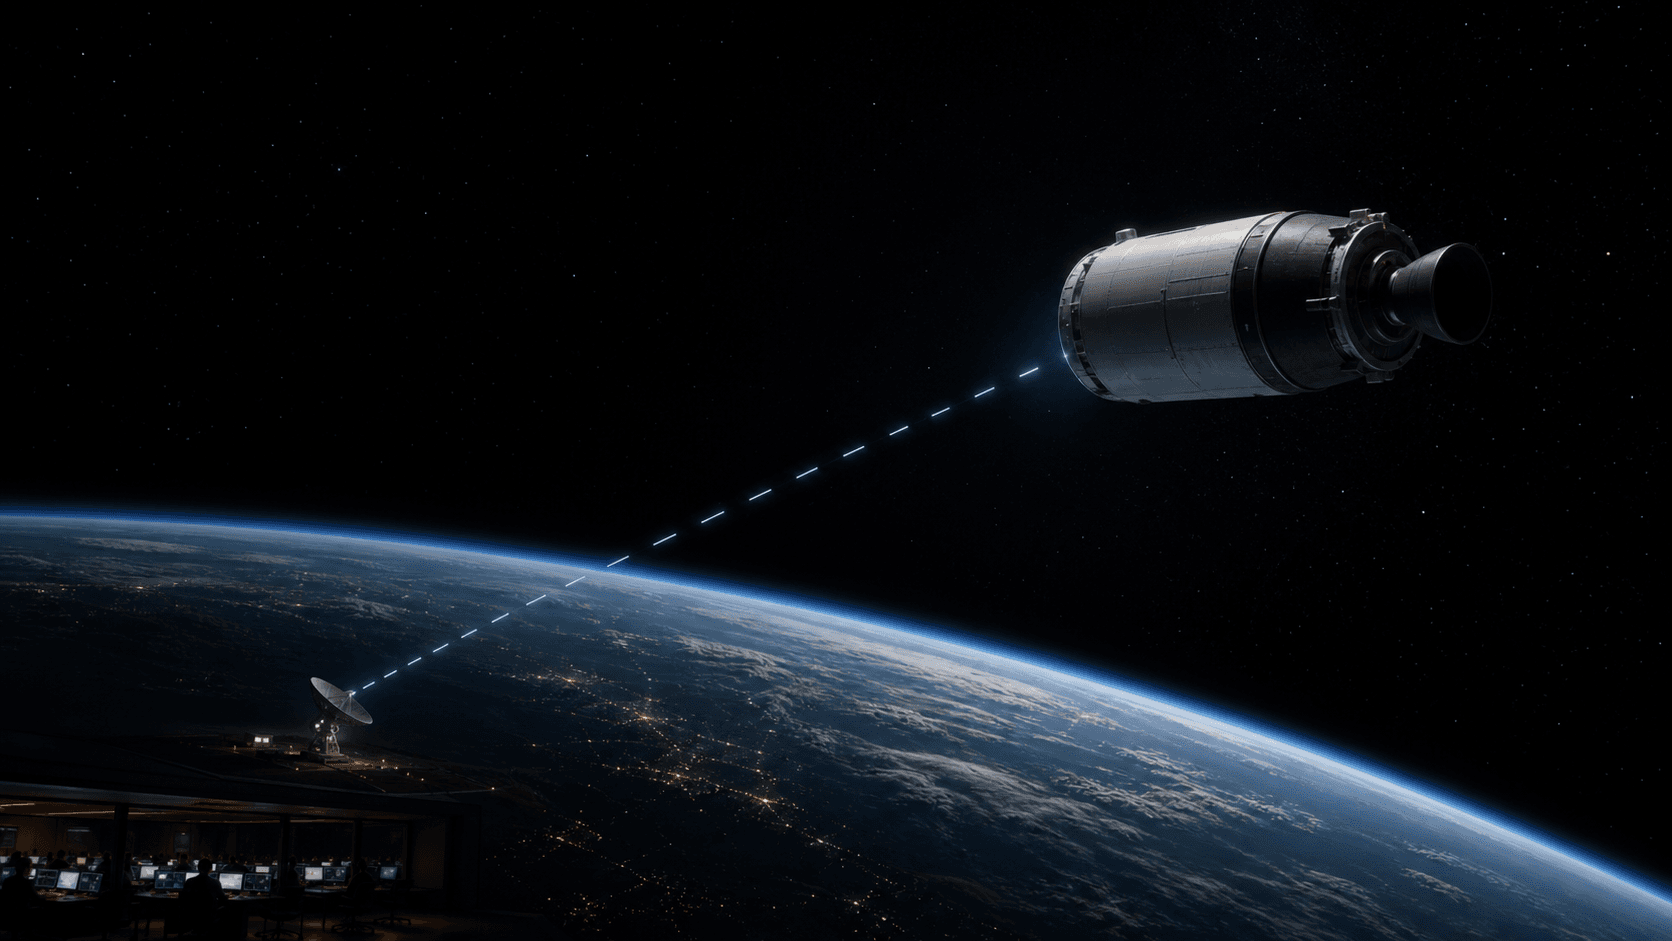
The word telemetry joins the ideas of distance and measurement. Sensors aboard a vehicle turn temperatures, pressures, voltages, motion, switch states, and other conditions into data that can be transmitted to the ground.
The ground system receives, decodes, displays, and archives those measurements. A telemetry display is therefore not a window or camera. It is a reconstruction built from packets that travelled through several systems.
A channel is more than the number in large type
Suppose a display shows vehicle acceleration as 0.18 g. The number has meaning only after the channel identifies what was measured, the unit explains how it is expressed, and the sample time tells us when the measurement belonged to the vehicle.
A value may arrive later than it was measured. During a weak link, the newest number on screen can be several seconds old even while the mission clock continues to advance.
A suspicious display does not automatically mean a sick vehicle
A channel can become suspect because packets arrived late, frames were rejected, the receiver lost lock, or a sample stopped updating. Those are data-path conditions. They change how much confidence an operator can place in the display.
Vehicle health is a different question. A fresh, high-quality pressure or acceleration measurement outside its expected behaviour can support a vehicle anomaly. A stale value cannot provide the same evidence, even if the number looks alarming.
Normal changes when the mission phase changes
High dynamic pressure can be expected near Max Q but not after the vehicle has left the dense atmosphere. Near-zero acceleration can be suspicious during an active burn yet normal immediately after engine cutoff.
An expected range is therefore not one permanent green zone. Procedures, predictions, and mission events define what should happen during this particular phase.
One point raises a question; several channels build a case
A trend shows direction. During upper-stage acceleration, horizontal velocity should rise while propellant falls. If acceleration falls unexpectedly and velocity begins to lag while the link remains good, several independent clues point toward the vehicle.
Operators compare nearby channels, events, logs, and expected behaviour before acting. Correlation reduces the risk of treating one noisy sensor, one delayed packet, or one misunderstood phase as the whole story.
Mission Control reads in a deliberate order
Begin with mission time and phase. Check sample freshness and quality next. Only then compare the value and trend with the expected behaviour, and finally correlate the result with other channels and events.
This order does not replace procedures or specialist judgement. It gives a beginner a reliable first pass and prevents the most common mistake in the Vastward mission: assuming that every suspect tile proves the vehicle is unhealthy.
Decide Whether the Vehicle or the Data Needs Attention
Replay four mission moments, inspect channel freshness, quality, expected range, and trend, then separate a communication problem from a vehicle anomaly.
First-stage ascent through Max Q
Dynamic pressure is high because the vehicle is moving quickly through enough atmosphere to create the mission's peak aerodynamic load.
- Mission elapsed time
- T+01:10
- Telemetry link quality
- 99%
- Evidence points to
- Vehicle and data nominal
Vehicle altitude
Where is the vehicle relative to the modelled surface?
- Received value
- 12 km
- Sample age
- 0.18 s old
- Recent trend
- Rising
- Expected in this phase
- 9-15 km
The received value lies inside this phase's expected range.
Altitude is increasing inside the planned Max Q corridor.
The link is strong, every channel is fresh, and the values agree with this phase. High dynamic pressure is expected here rather than an anomaly by itself.
This sample is current and marked GOOD. Its value can contribute to a vehicle-health judgement.
At T+02:40, four values have not refreshed for more than four seconds, one channel is missing, and link quality is 38%. What should Mission Control conclude first?
Sources and evidence boundary
Vastward wrote this explanation independently and checked it against the official and research sources below. Each source supports a specific part of the evidence chain.
- Reviewed sourceBasics of Space Flight: Chapter 10, TelecomNASA ScienceOpen official source
- Reviewed sourceBasics of Space Flight: Chapter 15, CruiseNASA ScienceOpen official source
- Reviewed sourceGround Data Systems and Mission OperationsNASA Small Spacecraft Systems Virtual InstituteOpen official source