
Object profile · EARTH
Earth
Rocky planet with surface oceans
Our measured home world, shaped by liquid water, moving rock, an active atmosphere and life.
- Atlas data reviewed
- Editorial stage
- Published
- Visibility
- Public
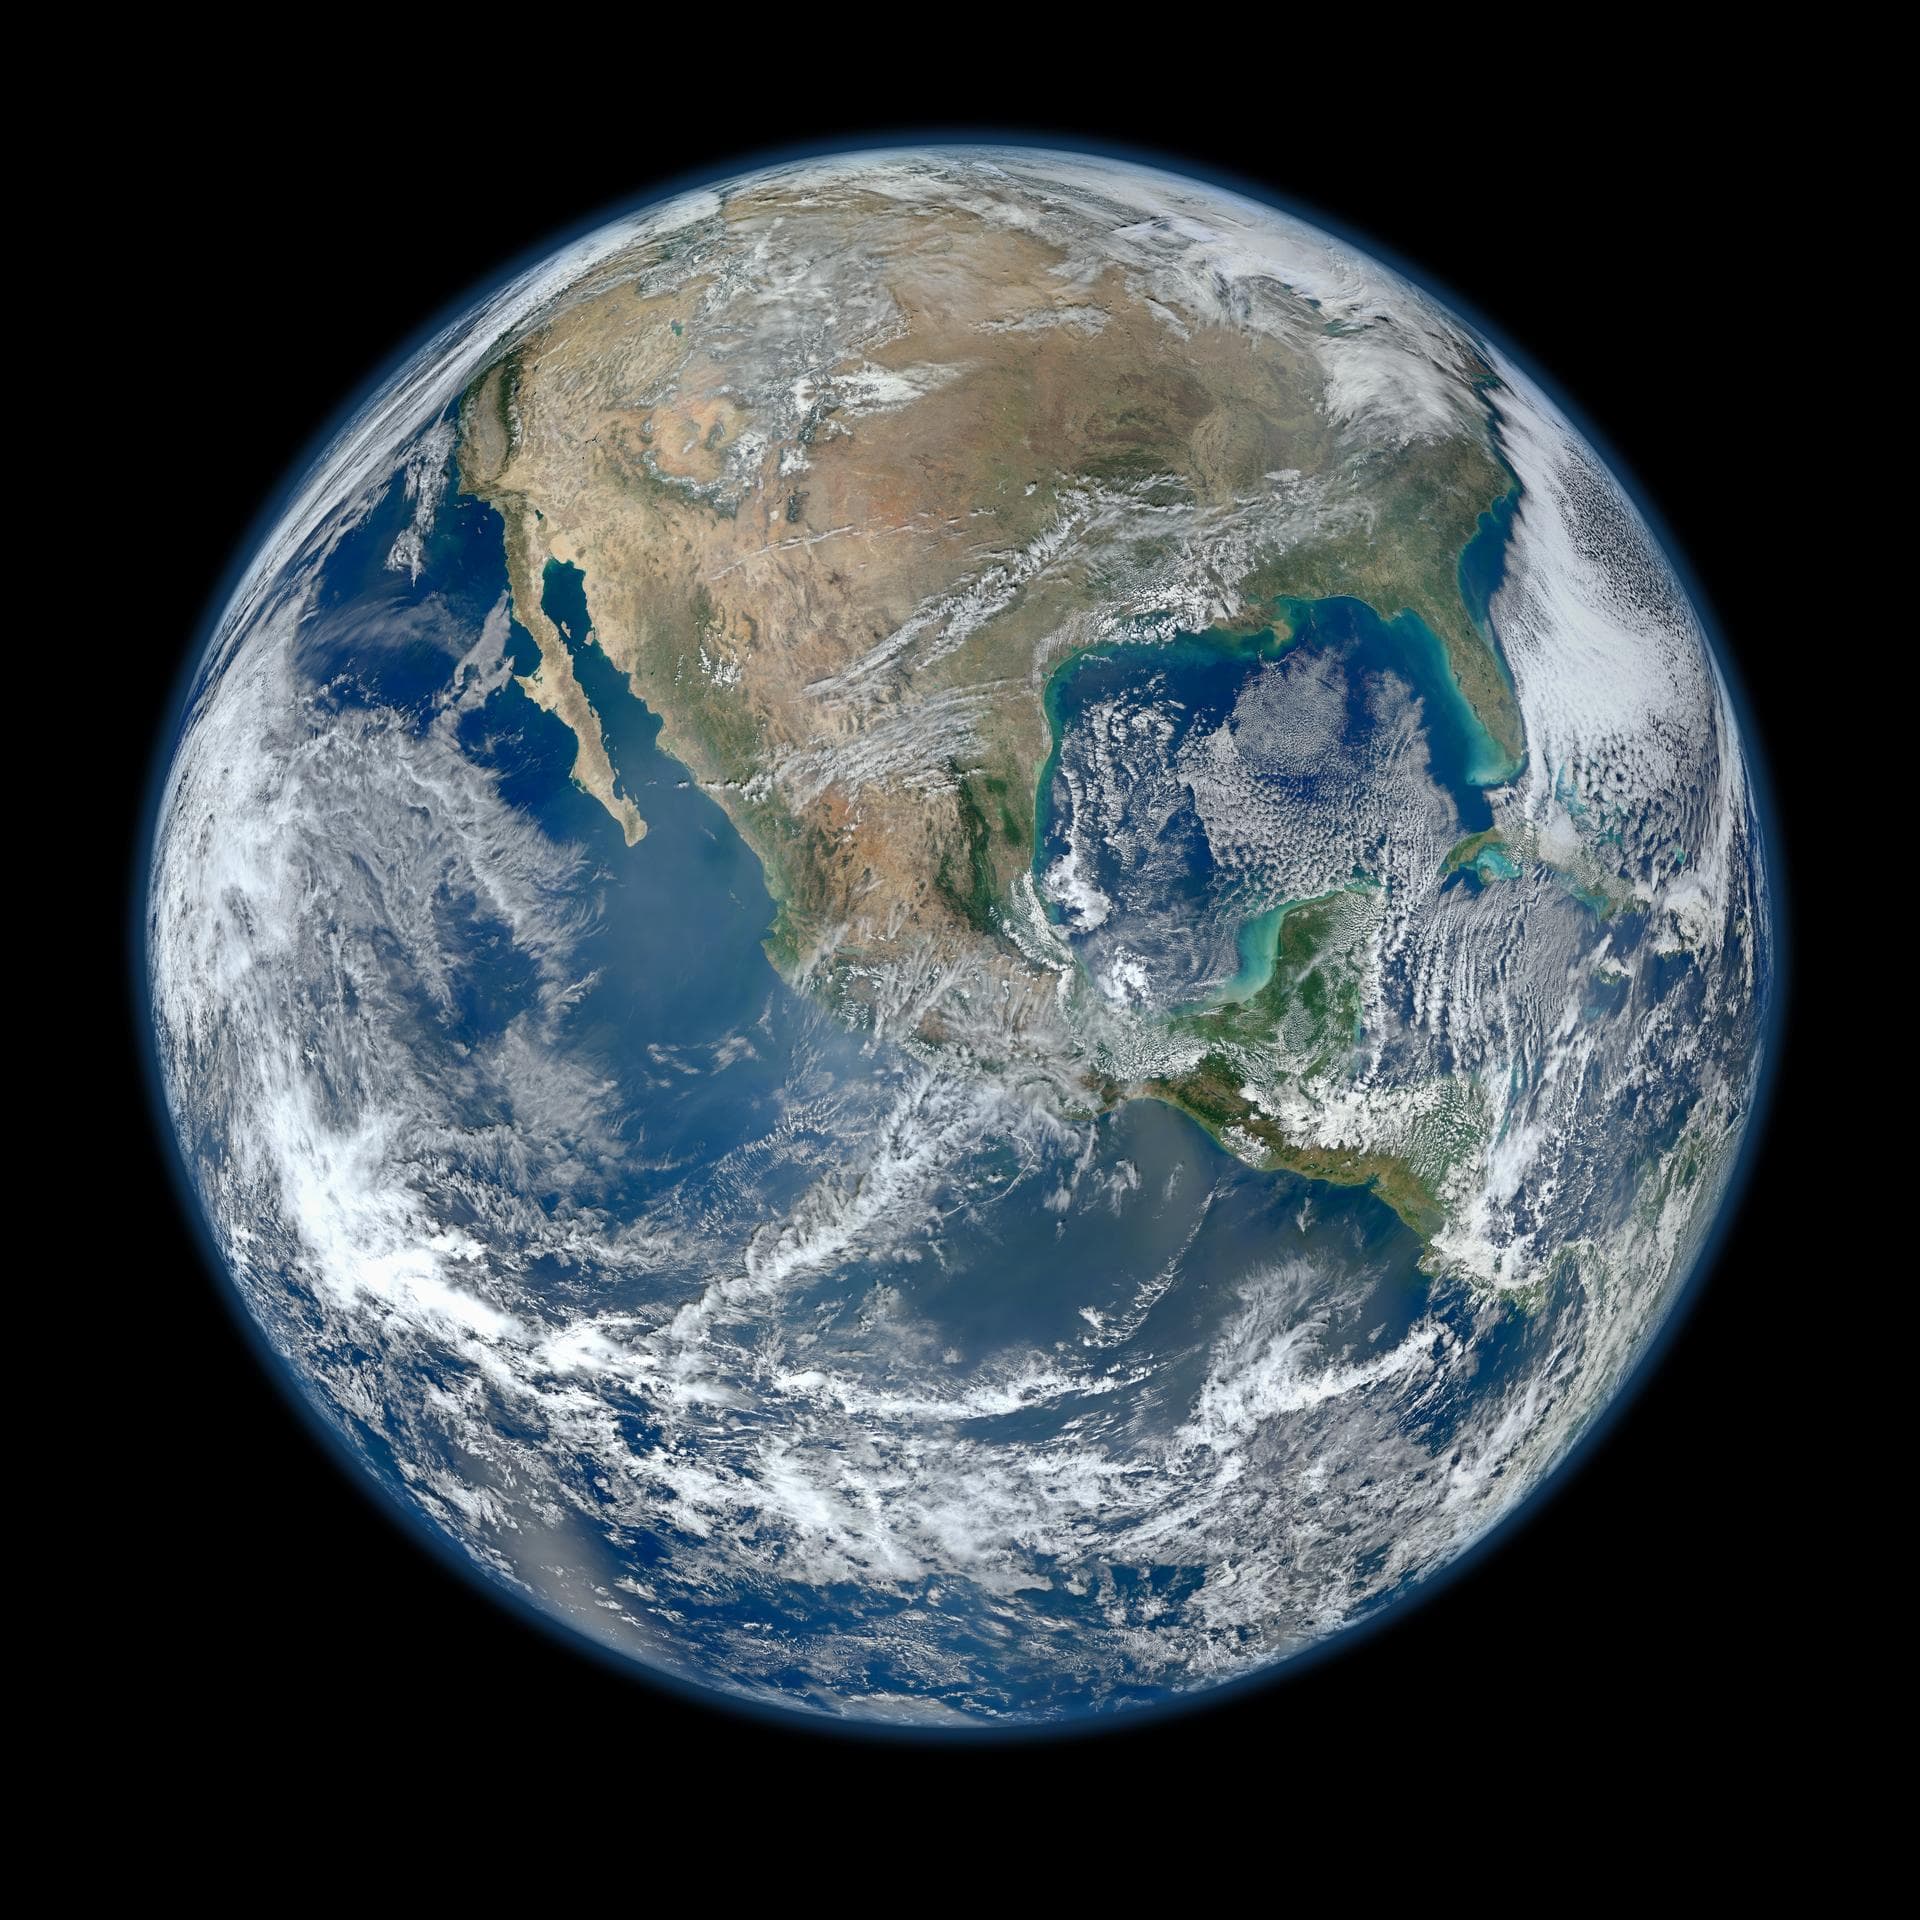 Direct observation
Data mosaic, not one instantaneous photograph. Multiple orbital swaths from 4 January 2012 were combined to make a full-disk natural-color view; the image is not a distance scale.
NASA/NOAA/GSFC/Suomi NPP/VIIRS/Norman Kuring ↗What this world is
Earth is not the default form of a planet. It is a rocky world whose temperature and pressure let liquid water persist across much of its surface. Oceans, air, living systems and a slowly moving rocky shell continuously reshape what we see.
Why it looks this way now
Earth's present state comes from several connected systems: heat left from formation and radioactive decay drives interior motion, sunlight powers weather and climate, gravity holds the atmosphere and oceans, and life has changed atmospheric chemistry over billions of years.
Where it sits
Earth is the third planet from the Sun. Its average solar distance is about 150 million kilometres, defined close to one astronomical unit. The Moon orbits Earth, while the Earth-Moon system travels around the Sun.
Swipe sideways to inspect the full map
The blue orbit, marker and name locate Earth without implying its live position today.
Venus is immediately inside; Mars is immediately outside. The lower sequence preserves all eight positions.
Read the numbers
Reference values retain their units, context, evidence state and published uncertainty.
Physical measurements
- Mean radiusglobal mean
- 6,371.0084kmCalculated measurementAbout 6,371 km from the centre to a mean surface.
Earth is slightly wider at the equator, so one radius cannot describe every direction.
Published uncertainty: ± 0.0001 km
JPL tabulated uncertainty for the adopted mean radius.
- Massglobal mean
- 5.97217E24kgCalculated measurementThe reference mass behind the familiar unit 1 Earth mass.
In practice scientists infer mass from how gravity changes motion.
Published uncertainty: ± 2.8E20 kg
Converted from the uncertainty in the JPL 10^24 kilogram table.
- Mean densityglobal mean
- 5.5134g/cm³Calculated measurementAbout 5.5 times the density of water.
This global average combines a light crust and mantle with a dense metal core.
Published uncertainty: ± 0.0003 g/cm³
Calculated from the adopted mass and volume.
- Reference gravityequatorial reference
- 9.80m/s²Calculated measurementThe everyday baseline often called 1 g.
The listed value is equatorial; your local value is slightly different.
No uncertainty published in this source table
JPL lists equatorial gravity without a table uncertainty; local gravity varies with latitude and elevation.
- Temperatureverified station extreme
- -89.2°CDirect observationA verified surface air record at Vostok, Antarctica.
This is a local station measurement, not Earth's average temperature.
No uncertainty published in this source table
Verified station record at Vostok, Antarctica, not a planetary minimum for every place or time.
- Temperatureverified station extreme
- 56.7°CDirect observationA verified surface air record at Furnace Creek, United States.
This is a local station measurement, not Earth's average temperature.
No uncertainty published in this source table
Verified station record at Furnace Creek, United States, not a planetary maximum for every place or time.
Orbit and rotation
- Average distancerelative to the Sun
- 150,196,428kmCalculated measurementLight takes about 8 minutes 20 seconds to cross a similar distance.
The actual Earth-Sun distance changes along the orbit.
Approximate value
A rounded average. Earth's actual Sun distance changes throughout its elliptical orbit.
- Rotation periodrelative to distant stars
- 0.99726968Earth daysCalculated measurementAbout 23 hours 56 minutes relative to distant stars.
A solar day is about four minutes longer because Earth also moves around the Sun.
No uncertainty published in this source table
Sidereal rotation period in mean Earth days; the familiar solar day is about 24 hours.
- Orbital periodrelative to distant stars
- 1.0000174Earth yearsCalculated measurementJust over one Julian year relative to distant stars.
Calendar rules keep civil years aligned with seasons.
No uncertainty published in this source table
Sidereal orbital period in Julian years.
Atmosphere and inside
Atmosphere
Dry air near the surface is roughly 78 percent nitrogen, 21 percent oxygen and about 1 percent argon plus trace gases. Water vapour varies strongly by place and time, so it is not represented as one fixed fraction here.
- Nitrogen78%
- Oxygen21%
- Argon and trace gases1%
Surface and interior
Direct access reaches only a tiny part of Earth. The crust is observed and sampled, while most of the mantle and core are reconstructed from seismic waves, gravity, magnetic behaviour, laboratory physics and models.
- 1Inner core
A solid iron and nickel center inferred mainly from how seismic waves cross Earth.
Scientific model - 2Outer core
A liquid metal layer whose moving conductive material helps generate Earth's magnetic field.
Scientific model - 3Mantle
Hot rock that is mostly solid but can flow slowly over geologic time.
Scientific model - 4Crust
The thin rocky outer shell beneath continents and oceans.
Direct observation
How we know
Shape and rotation come from geodesy. Mass comes from gravity and orbital motion. Density combines mass with modeled volume. Temperature records come from calibrated local stations and must keep their location and observing context.
- 01Calculated measurement
Geodesy and gravity mapping
Satellite ranging, positioning networks and surface surveys solve for Earth's shape, rotation and changing gravity field.
Where this method stops
The result is a reference model. Local elevation, tides and mass movement make the real field vary.
- 02Calculated measurement
Orbital tracking
Radio and laser tracking compare predicted and measured motion. Gravity parameters are fitted until the orbit solution matches observations.
Where this method stops
Mass is inferred through gravity and an adopted gravitational constant, not placed on a scale.
- 03Direct observation
Surface weather stations
Calibrated instruments record air temperature at defined sites, times and exposure conditions.
Where this method stops
A station record is local. It should not be read as the temperature of the whole planet.
Evidence key
- Direct observation
- An instrument or sample recorded the phenomenon, with processing still disclosed.
- Calculated measurement
- Observed motion or signal is converted into a physical quantity using equations and reference constants.
- Scientific model
- A tested interpretation that fits observations but is not directly imaged or sampled.
- Vastward explanation
- Original beginner-facing synthesis, traceable to the source records but not itself a measurement.
- Artist visualization
- An interpretive image, not observational evidence.
Missions and instruments
GRACE Follow-On
Twin satellites measure tiny changes in their separation to map how water, ice and other mass move around Earth.
Official mission ↗- Microwave Ranging InstrumentChanges in distance between the two GRACE-FO spacecraft caused by variations in Earth's gravity.
Suomi NPP
Its VIIRS instrument observes land, ocean, atmosphere and clouds; multiple orbital swaths formed this hero mosaic.
Official mission ↗Official source trail
Links below are the exact records used for this profile. Access dates are retained with the content.
- 01
NASA Jet Propulsion Laboratory, Solar System Dynamics · dataset
Planetary Physical Parameters
- Source updated
- No source update date published
- Access checked
- 2026-07-29
- 02
NASA Science · official-page
Earth Facts
- Source updated
- 2025-12-05
- Access checked
- 2026-07-29
- 03
World Meteorological Organization · official-document
World Weather and Climate Extremes Archive: Global Temperature Records
- Source updated
- 2024-07-02
- Access checked
- 2026-07-29
- 04
NASA Goddard Space Flight Center · image
Most Amazing High Definition Image of Earth: Blue Marble 2012
- Source updated
- 2023-05-30
- Access checked
- 2026-07-29
- 05
NASA Science · official-page
GRACE Follow-On
- Source updated
- No source update date published
- Access checked
- 2026-07-29
Continue exploring
Atlas is a starting point. Use these relationships to move into explanation, experiment and mission thinking.
Separate mass from weight
Use Earth as the reference, then ask what changes when gravity changes.
academyAvailable nowRead density as a clue
Connect a global average to the hidden materials inside a planet.
academyModel an energy balance
Explore how incoming sunlight and outgoing heat shape planetary temperature.
lab